
Cross-Venue Vectors: How Spatial Metrics from Soccer Pitches and Racetrack Surfaces Inform Layered Selection Protocols
Analysts in professional sports examine spatial metrics from soccer pitches and racetrack surfaces to build layered selection protocols that match athletes and animals to venue characteristics. These protocols layer data on movement vectors, surface friction coefficients, and boundary geometries to guide decisions about team lineups and race entries.
Researchers at institutions such as the University of Queensland have documented how pitch dimensions and camber angles affect player acceleration patterns during matches. Similar measurements on racetracks reveal curvature radii and banking degrees that influence stride lengths in thoroughbreds. Data integration occurs through multi-stage filtering where initial venue profiles feed into secondary models that rank candidate selections.
Venue Geometry and Movement Mapping
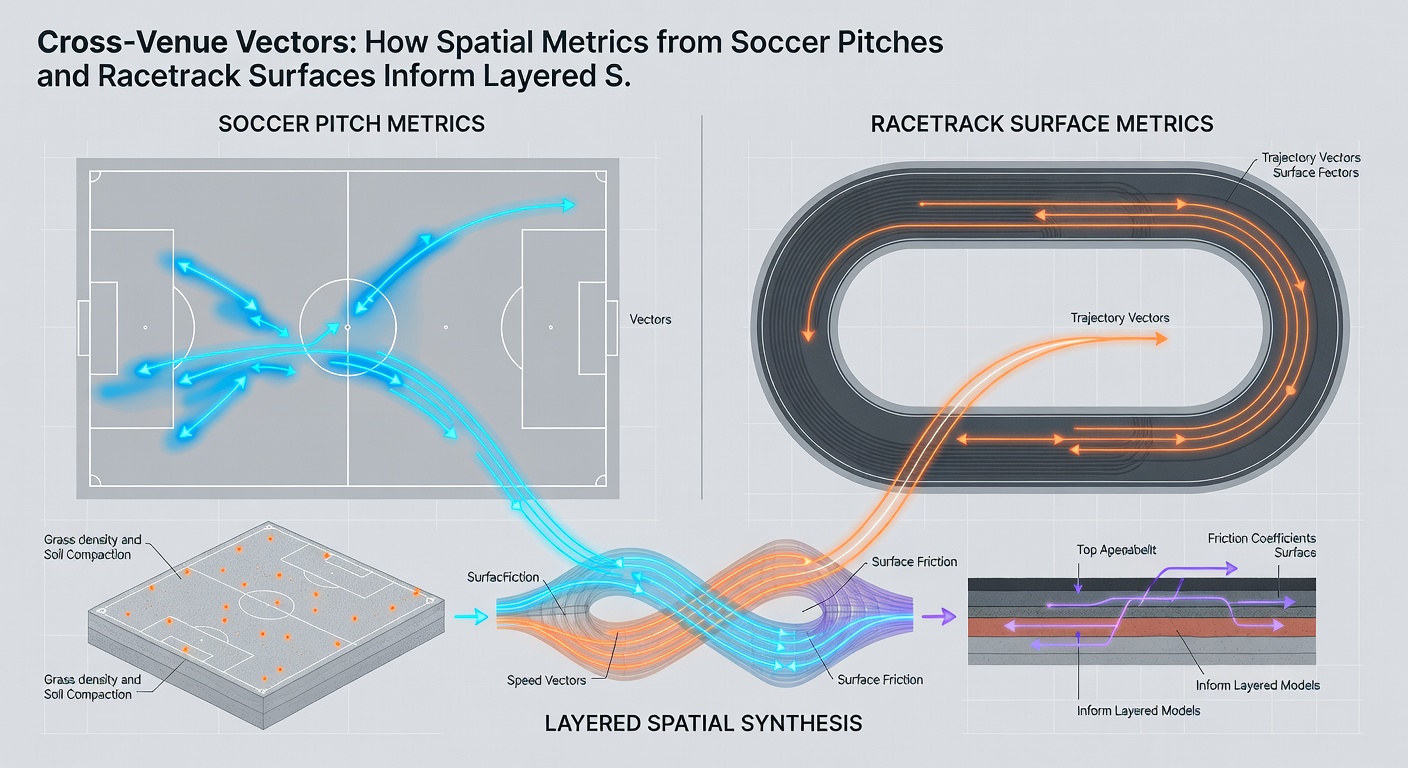
Soccer pitches vary in length from 100 to 110 meters and width from 64 to 75 meters according to FIFA guidelines, which creates distinct vector fields for passing networks and defensive pressing. Observers note that teams collect GPS traces from training sessions to quantify how players cover these spaces under different surface conditions. Racetrack surfaces present analogous challenges through straight sections transitioning into turns with specific superelevation values that redistribute load across a horse's limbs.
Layered protocols begin with primary spatial scans that record baseline metrics like average speed zones and directional change frequencies. Secondary layers incorporate historical performance data filtered by those same spatial parameters, allowing selectors to identify patterns where certain profiles align with particular venue features. This approach draws from studies published through the International Society of Biomechanics in Sports, which emphasize vector-based comparisons across disciplines.
Surface Interaction Data Integration
Soil compaction rates and grass root density on soccer fields interact with player footwear choices, producing measurable differences in traction during cutting maneuvers. Racetrack maintenance crews track cushion depth and moisture gradients that alter ground reaction forces for equine athletes. Selection teams combine these readings with positional data to construct heat maps that highlight optimal entry points for specific competitors.
One protocol used by European football clubs and Australian racing authorities applies a three-tier matrix. The first tier maps raw spatial coordinates, the second applies biomechanical multipliers derived from force-plate testing, and the third generates ranked shortlists for final review. Figures from the National Institutes of Health biomechanics archive show how such layering reduces mismatch rates between athlete capabilities and venue demands.
Real-Time Adjustments and Protocol Refinement
During the May 2026 racing and football seasons, several organizations updated their spatial databases with new LiDAR scans that capture micro-variations in surface elevation. These updates feed directly into selection algorithms that recalibrate vector thresholds after each event cycle. Analysts cross-reference live tracking outputs against archived venue profiles to refine weighting factors in the layered models.
Coaches and trainers review aggregated outputs rather than isolated statistics, which allows them to account for interactions between pitch width and horse stride adaptation on cambered turns. The process avoids single-metric reliance by maintaining parallel data streams that converge only at the final ranking stage.
Cross-Disciplinary Applications
Protocols developed for soccer have been adapted for harness racing circuits where track widths and barrier placements create comparable spatial constraints. Conversely, equine gait analysis software now informs soccer recovery programs that monitor how players navigate uneven turf patches. Shared computational frameworks process both sets of inputs through standardized vector normalization routines.
Evidence from joint workshops hosted by the European College of Sport Science indicates that these transfers improve prediction accuracy when venue-specific variables are held constant. Selection committees therefore maintain shared repositories that store normalized spatial datasets across both sports.
Conclusion
Spatial metrics continue to shape layered selection protocols by providing quantifiable links between venue geometry and performance outcomes. Organizations that maintain consistent data pipelines across soccer pitches and racetrack surfaces report more precise alignment between competitors and competition environments. Ongoing refinements in measurement technology support incremental improvements in how these protocols process vector information and surface interactions.